


Harpers Ferry district, Jefferson County, West Virginia
About
Outline

Summary
| Unique Area Identifier | 155915 |
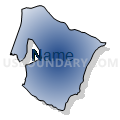
| Name | Harpers Ferry district |
| County | Jefferson County |
| State | West Virginia |
| Area (square miles) | 33.45 |
| Land Area (square miles) | 32.45 |
| Water Area (square miles) | 0.99 |
| % of Land Area | 97.03 |
| % of Water Area | 2.97 |
| Latitude of the Internal Point | 39.30580070 |
| Longtitude of the Internal Point | -77.79455770 |
| Total Population | 10,518 |
| Total Housing Units | 4,350 |
| Total Households | 3,908 |
| Median Age | 38.3 |
Maps


Graphs
Select a template below for downloading or customizing gragh for Harpers Ferry district, Jefferson County, West Virginia


Neighbors
Neighoring County Subdivision (by Name) Neighboring County Subdivision on the Map
- District 11, Sandy Hook, Washington County, MD
- Blue Ridge district, Loudoun County, VA
- Charles Town district, Jefferson County, WV
- Kabletown district, Jefferson County, WV
- Middleway district, Jefferson County, WV
- Shepherdstown district, Jefferson County, WV
Top 10 Neighboring Place (by Population) Neighboring Place on the Map
- Charles Town city, WV (5,259)
- Ranson corporation, WV (4,440)
- Shannondale CDP, WV (3,358)
- Bolivar town, WV (1,045)
- Shenandoah Junction CDP, WV (703)
- Harpers Ferry town, WV (286)
Top 10 Neighboring Unified School District (by Population) Neighboring Unified School District on the Map
- Loudoun County Public Schools, VA (312,311)
- Washington County Public Schools, MD (147,430)
- Jefferson County School District, WV (53,498)
Top 10 Neighboring State Legislative District Lower Chamber (by Population) Neighboring State Legislative District Lower Chamber on the Map
- State House District 33, VA (113,100)
- State Legislative Subdistrict 3B, MD (54,040)
- State House District 56, WV (25,419)
- State House District 58, WV (21,829)
- State House District 57, WV (21,709)
Top 10 Neighboring State Legislative District Upper Chamber (by Population) Neighboring State Legislative District Upper Chamber on the Map
- State Senate District 27, VA (227,068)
- State Senate District 16, WV (149,067)
- State Senate District 3, MD (147,548)
Top 10 Neighboring 111th Congressional District (by Population) Neighboring 111th Congressional District on the Map
- Congressional District 10, VA (869,437)
- Congressional District 6, MD (738,943)
- Congressional District 2, WV (648,186)
Top 10 Neighboring Census Tract (by Population) Neighboring Census Tract on the Map
- Census Tract 115, Washington County, MD (8,006)
- Census Tract 6102.01, Loudoun County, VA (4,268)
- Census Tract 9724.02, Jefferson County, WV (4,061)
- Census Tract 9727.02, Jefferson County, WV (4,015)
- Census Tract 9726.02, Jefferson County, WV (3,854)
- Census Tract 6101.01, Loudoun County, VA (3,843)
- Census Tract 9725.06, Jefferson County, WV (3,410)
- Census Tract 9725.03, Jefferson County, WV (3,154)
- Census Tract 9722.04, Jefferson County, WV (2,838)
- Census Tract 9727.01, Jefferson County, WV (2,752)
Top 10 Neighboring 5-Digit ZIP Code Tabulation Area (by Population) Neighboring 5-Digit ZIP Code Tabulation Area on the Map
- 25414, WV (17,024)
- 20132, VA (15,900)
- 25425, WV (12,835)
- 25438, WV (6,266)
- 21758, MD (4,921)
- 25442, WV (1,925)
- 25432, WV (121)
Data
Demographic, Population, Households, and Housing Units
** Data sources from census 2010 **
Show Data on Map
Download Full List as CSV
Download Quick Sheet as CSV
| Subject | This Area | Jefferson County | West Virginia | National |
|---|---|---|---|---|
| POPULATION | ||||
| Total Population Map | 10,518 | 53,498 | 1,852,994 | 308,745,538 |
| POPULATION, HISPANIC OR LATINO ORIGIN | ||||
| Not Hispanic or Latino Map | 10,114 | 51,009 | 1,830,726 | 258,267,944 |
| Hispanic or Latino Map | 404 | 2,489 | 22,268 | 50,477,594 |
| POPULATION, RACE | ||||
| White alone Map | 9,471 | 46,876 | 1,739,988 | 223,553,265 |
| Black or African American alone Map | 540 | 3,524 | 63,124 | 38,929,319 |
| American Indian and Alaska Native alone Map | 15 | 132 | 3,787 | 2,932,248 |
| Asian alone Map | 124 | 618 | 12,406 | 14,674,252 |
| Native Hawaiian and Other Pacific Islander alone Map | 3 | 33 | 428 | 540,013 |
| Some Other Race alone Map | 125 | 946 | 6,119 | 19,107,368 |
| Two or More Races Map | 240 | 1,369 | 27,142 | 9,009,073 |
| POPULATION, SEX | ||||
| Male Map | 5,290 | 26,444 | 913,586 | 151,781,326 |
| Female Map | 5,228 | 27,054 | 939,408 | 156,964,212 |
| POPULATION, AGE (18 YEARS) | ||||
| 18 years and over Map | 7,831 | 40,794 | 1,465,576 | 234,564,071 |
| Under 18 years | 2,687 | 12,704 | 387,418 | 74,181,467 |
| POPULATION, AGE | ||||
| Under 5 years | 721 | 3,377 | 104,060 | 20,201,362 |
| 5 to 9 years | 786 | 3,746 | 106,016 | 20,348,657 |
| 10 to 14 years | 732 | 3,508 | 109,045 | 20,677,194 |
| 15 to 17 years | 448 | 2,073 | 68,297 | 12,954,254 |
| 18 and 19 years | 264 | 1,735 | 51,795 | 9,086,089 |
| 20 years | 120 | 802 | 25,873 | 4,519,129 |
| 21 years | 112 | 826 | 24,305 | 4,354,294 |
| 22 to 24 years | 317 | 1,863 | 67,026 | 12,712,576 |
| 25 to 29 years | 576 | 2,872 | 108,444 | 21,101,849 |
| 30 to 34 years | 656 | 3,156 | 112,254 | 19,962,099 |
| 35 to 39 years | 827 | 3,682 | 117,136 | 20,179,642 |
| 40 to 44 years | 900 | 4,143 | 120,358 | 20,890,964 |
| 45 to 49 years | 890 | 4,417 | 132,924 | 22,708,591 |
| 50 to 54 years | 836 | 4,033 | 143,232 | 22,298,125 |
| 55 to 59 years | 706 | 3,604 | 139,368 | 19,664,805 |
| 60 and 61 years | 243 | 1,432 | 53,956 | 7,113,727 |
| 62 to 64 years | 365 | 1,915 | 71,501 | 9,704,197 |
| 65 and 66 years | 187 | 986 | 38,447 | 5,319,902 |
| 67 to 69 years | 204 | 1,277 | 53,281 | 7,115,361 |
| 70 to 74 years | 261 | 1,575 | 71,792 | 9,278,166 |
| 75 to 79 years | 164 | 1,051 | 54,725 | 7,317,795 |
| 80 to 84 years | 109 | 759 | 43,238 | 5,743,327 |
| 85 years and over | 94 | 666 | 35,921 | 5,493,433 |
| MEDIAN AGE BY SEX | ||||
| Both sexes Map | 38.30 | 38.90 | 41.30 | 37.20 |
| Male Map | 38.10 | 38.50 | 40.10 | 35.80 |
| Female Map | 38.50 | 39.30 | 42.60 | 38.50 |
| HOUSEHOLDS | ||||
| Total Households Map | 3,908 | 19,931 | 763,831 | 116,716,292 |
| HOUSEHOLDS, HOUSEHOLD TYPE | ||||
| Family households: Map | 2,813 | 13,971 | 502,332 | 77,538,296 |
| Husband-wife family Map | 2,247 | 10,948 | 380,426 | 56,510,377 |
| Other family: Map | 566 | 3,023 | 121,906 | 21,027,919 |
| Male householder, no wife present Map | 201 | 1,005 | 36,374 | 5,777,570 |
| Female householder, no husband present Map | 365 | 2,018 | 85,532 | 15,250,349 |
| Nonfamily households: Map | 1,095 | 5,960 | 261,499 | 39,177,996 |
| Householder living alone Map | 846 | 4,534 | 217,308 | 31,204,909 |
| Householder not living alone Map | 249 | 1,426 | 44,191 | 7,973,087 |
| HOUSEHOLDS, HISPANIC OR LATINO ORIGIN OF HOUSEHOLDER | ||||
| Not Hispanic or Latino householder: Map | 3,816 | 19,341 | 757,775 | 103,254,926 |
| Hispanic or Latino householder: Map | 92 | 590 | 6,056 | 13,461,366 |
| HOUSEHOLDS, RACE OF HOUSEHOLDER | ||||
| Householder who is White alone | 3,618 | 17,893 | 725,684 | 89,754,352 |
| Householder who is Black or African American alone | 176 | 1,339 | 23,832 | 14,129,983 |
| Householder who is American Indian and Alaska Native alone | 6 | 62 | 1,655 | 939,707 |
| Householder who is Asian alone | 39 | 178 | 4,304 | 4,632,164 |
| Householder who is Native Hawaiian and Other Pacific Islander alone | 1 | 9 | 121 | 143,932 |
| Householder who is Some Other Race alone | 30 | 220 | 1,415 | 4,916,427 |
| Householder who is Two or More Races | 38 | 230 | 6,820 | 2,199,727 |
| HOUSEHOLDS, HOUSEHOLD TYPE BY HOUSEHOLD SIZE | ||||
| Family households: Map | 2,813 | 13,971 | 502,332 | 77,538,296 |
| 2-person household Map | 1,128 | 5,831 | 241,530 | 31,882,616 |
| 3-person household Map | 683 | 3,319 | 120,007 | 17,765,829 |
| 4-person household Map | 577 | 2,781 | 87,596 | 15,214,075 |
| 5-person household Map | 271 | 1,232 | 35,494 | 7,411,997 |
| 6-person household Map | 95 | 491 | 11,701 | 3,026,278 |
| 7-or-more-person household Map | 59 | 317 | 6,004 | 2,237,501 |
| Nonfamily households: Map | 1,095 | 5,960 | 261,499 | 39,177,996 |
| 1-person household Map | 846 | 4,534 | 217,308 | 31,204,909 |
| 2-person household Map | 209 | 1,139 | 36,807 | 6,360,012 |
| 3-person household Map | 27 | 191 | 4,872 | 992,156 |
| 4-person household Map | 8 | 65 | 1,841 | 411,171 |
| 5-person household Map | 3 | 20 | 488 | 126,634 |
| 6-person household Map | 2 | 9 | 111 | 48,421 |
| 7-or-more-person household Map | 0 | 2 | 72 | 34,693 |
| HOUSING UNITS | ||||
| Total Housing Units Map | 4,350 | 22,037 | 881,917 | 131,704,730 |
| HOUSING UNITS, OCCUPANCY STATUS | ||||
| Occupied Map | 3,908 | 19,931 | 763,831 | 116,716,292 |
| Vacant Map | 442 | 2,106 | 118,086 | 14,988,438 |
| HOUSING UNITS, OCCUPIED, TENURE | ||||
| Owned with a mortgage or a loan Map | 2,449 | 11,740 | 293,522 | 52,979,430 |
| Owned free and clear Map | 686 | 3,561 | 267,491 | 23,006,644 |
| Renter occupied Map | 773 | 4,630 | 202,818 | 40,730,218 |
| HOUSING UNITS, VACANT, VACANCY STATUS | ||||
| For rent Map | 70 | 431 | 19,521 | 4,137,567 |
| Rented, not occupied Map | 7 | 37 | 1,366 | 206,825 |
| For sale only Map | 88 | 362 | 10,381 | 1,896,796 |
| Sold, not occupied Map | 14 | 58 | 4,597 | 421,032 |
| For seasonal, recreational, or occasional use Map | 110 | 543 | 38,283 | 4,649,298 |
| For migrant workers Map | 1 | 1 | 118 | 24,161 |
| Other vacant Map | 152 | 674 | 43,820 | 3,652,759 |
| HOUSING UNITS, OCCUPIED, AVERAGE HOUSEHOLD SIZE BY TENURE | ||||
| Total: Map | 2.66 | 2.61 | 2.36 | 2.58 |
| Owner occupied Map | 2.68 | 2.67 | 2.43 | 2.65 |
| Renter occupied Map | 2.55 | 2.43 | 2.18 | 2.44 |
| HOUSING UNITS, OCCUPIED, TENURE BY RACE OF HOUSEHOLDER | ||||
| Owner occupied: Map | 3,135 | 15,301 | 561,013 | 75,986,074 |
| Householder who is White alone Map | 2,926 | 14,059 | 542,432 | 63,446,275 |
| Householder who is Black or African American alone Map | 124 | 798 | 11,020 | 6,261,464 |
| Householder who is American Indian and Alaska Native alone Map | 4 | 38 | 953 | 509,588 |
| Householder who is Asian alone Map | 30 | 134 | 2,278 | 2,688,861 |
| Householder who is Native Hawaiian and Other Pacific Islander alone Map | 0 | 6 | 59 | 61,911 |
| Householder who is Some Other Race alone Map | 22 | 124 | 610 | 1,975,817 |
| Householder who is Two or More Races Map | 29 | 142 | 3,661 | 1,042,158 |
| Renter occupied: Map | 773 | 4,630 | 202,818 | 40,730,218 |
| Householder who is White alone Map | 692 | 3,834 | 183,252 | 26,308,077 |
| Householder who is Black or African American alone Map | 52 | 541 | 12,812 | 7,868,519 |
| Householder who is American Indian and Alaska Native alone Map | 2 | 24 | 702 | 430,119 |
| Householder who is Asian alone Map | 9 | 44 | 2,026 | 1,943,303 |
| Householder who is Native Hawaiian and Other Pacific Islander alone Map | 1 | 3 | 62 | 82,021 |
| Householder who is Some Other Race alone Map | 8 | 96 | 805 | 2,940,610 |
| Householder who is Two or More Races Map | 9 | 88 | 3,159 | 1,157,569 |
| HOUSING UNITS, OCCUPIED, TENURE BY HISPANIC OR LATINO ORIGIN OF HOUSEHOLDER | ||||
| Owner occupied: Map | 3,135 | 15,301 | 561,013 | 75,986,074 |
| Not Hispanic or Latino householder Map | 3,064 | 14,929 | 557,790 | 69,617,625 |
| Hispanic or Latino householder Map | 71 | 372 | 3,223 | 6,368,449 |
| Renter occupied: Map | 773 | 4,630 | 202,818 | 40,730,218 |
| Not Hispanic or Latino householder Map | 752 | 4,412 | 199,985 | 33,637,301 |
| Hispanic or Latino householder Map | 21 | 218 | 2,833 | 7,092,917 |
| HOUSING UNITS, OCCUPIED, TENURE BY HOUSEHOLD SIZE | ||||
| Owner occupied: Map | 3,135 | 15,301 | 561,013 | 75,986,074 |
| 1-person household Map | 602 | 2,995 | 134,762 | 16,453,569 |
| 2-person household Map | 1,142 | 5,704 | 222,574 | 27,618,605 |
| 3-person household Map | 569 | 2,673 | 94,220 | 12,517,563 |
| 4-person household Map | 485 | 2,286 | 69,097 | 10,998,793 |
| 5-person household Map | 215 | 1,005 | 27,123 | 5,057,765 |
| 6-person household Map | 75 | 393 | 8,750 | 1,965,796 |
| 7-or-more-person household Map | 47 | 245 | 4,487 | 1,373,983 |
| Renter occupied: Map | 773 | 4,630 | 202,818 | 40,730,218 |
| 1-person household Map | 244 | 1,539 | 82,546 | 14,751,340 |
| 2-person household Map | 195 | 1,266 | 55,763 | 10,624,023 |
| 3-person household Map | 141 | 837 | 30,659 | 6,240,422 |
| 4-person household Map | 100 | 560 | 20,340 | 4,626,453 |
| 5-person household Map | 59 | 247 | 8,859 | 2,480,866 |
| 6-person household Map | 22 | 107 | 3,062 | 1,108,903 |
| 7-or-more-person household Map | 12 | 74 | 1,589 | 898,211 |
Loading...